 |
|
|||
Students' Perceptions Regarding E-learning
Miruna Mazurencu Marinescu
Constanta Mihaescu
Ileana Gabriela Niculescu-Aron
Laura Asandului
Keywords
E-learning, Internet, Inquiry, Sample, Educational process
Table of Contents
Setting The Scene. Sampling’s Objectives
Extracting The Sample
Data Analysis and Results’ Interpretation
Conclusions
References
Abstract
We live in an era where IC&T generates numerous transformations to the classic way of learning.
The most known results of these transformations concretise in two means of learning through IC&T: e-learning and computer assisted learning.
Just like the classical ones, these models assume the existence of an efficient learning process based on an efficient cooperation and
a communication activity well established. Within this framework, the following question arises: „How this new method of learning is perceived and when it is best used and placed during the instruction process?”.
Seeking an answer to the above mentioned question, a joint academic staff from the reputed Iasi’s University Al. I. Cuza an the well-known
Academy of Economic Studies of Bucharest have organized an inquiry through the students from both institutions regarding the perceptions,
attitudes and expectations regarding e-learning. This paper briefly presents the main findings of this inquiry.
Setting The Scene. Sampling’s Objectives
Nowadays one can affirm that Internet became the arbiter of the access to education and culture and the e-learning a new way of learning to improve the growing needs for knowledge and continuous training. Its utility and also its benefits are obvious, but the main issue to be still sorted out is how to incorporate this new form of education in the already existing structures. This study was carried out based on the students’ sampling from Iasi’s University Al. I. Cuza and Academy of Economic Studies of Bucharest and had as main intention to approach this topic having as objectives, the followings:
1. To define the computer’s role in the learning process;
2. To evaluate e-learning according to specific criteria of any educational process;
3. To place e-learning in the educational process.
Extracting The Sample
In order to determine the sample’s size, questionnaire pre-testing data were used. The knowledge of the term e-learning was used as research variable, for which 24% responses were affirmative and 76% were negative. The probability was 95%, for which z = 1,96, and the maximum accepted error is 4%. Therefore, the sample volume for Academy of Economic Studies of Bucharest was 420 students and for the Al. I. Cuza University of 400 people.
The sample is random and proportionally stratified in two strata. The strata were formed using two variables, one in each stage. In the first stage we formed the strata using as variable the domain. The 2nd, 3rd, 4th and 5th year students of Al. I. Cuza University and the Academy of Economic Studies of Bucharest form the population. The population was structured in 6 strata for which the proportion of each stratum in the total population was calculated. Based on these proportions the sample size was divided in six strata.
In the second stage of the sample, the stratification variable is the study year. The units have been randomly extracted from the 6 strata, using as variable the year of study.
Data Analysis and Results’ Interpretation
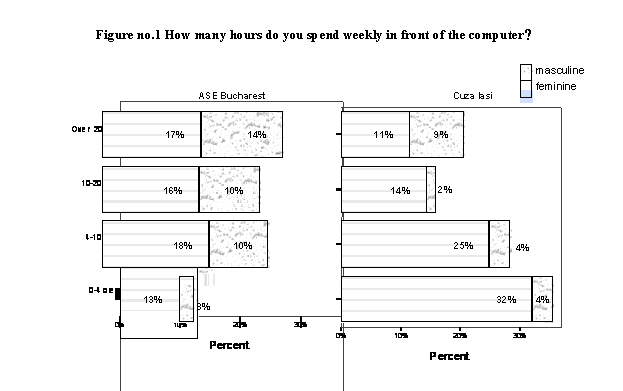
Data analysis reveals that the time spent in front of the computer by the students from the two university centres are different (see figure no. 1). The average number of hours spent in front of the computer by an ASE student is 13,8 (with a limit error of 0,82) in comparison with only 10,15 hours (with a limit error of 0,85) spent by a student from Iasi. A 95% confidence interval for the results is used.
The z statistics is used to compare the means with a calculated value of 5,982. We can affirm that the difference between the two means is statistically significant for a probability of 99,9999%.
If we carefully analyse the repartition of the number of hours spent in front of the computer from figure no.1, we can affirm that the high frequencies are in the groups with 0 to 4 hours and 4 to 10 hours for Iasi University and are explained by the different behaviour of the female students from this university. Thus the 267 ASE female students are equally distributed on the four groups, function of the number of hours spent in front of the computer (the percentage varies from 20,2% to 28%). At UAIC the distribution is decreasing, 38,8% in the group 0 to 4 hours and only 13,8% in the group with over 20 hours.
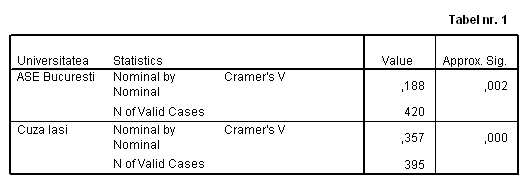
In order to highlight the importance of the “sex” variable Cramer’s V coefficient was used. We preferred this indicator because it ranges between 0 and 1 in comparison with the contingency coefficient, for which the number of rows and columns of the contingency table gives the upper limit.
The relation for V is:
![]() , where n is the sample’s size and c is the smallest value
between the number of rows and the number of columns.
, where n is the sample’s size and c is the smallest value
between the number of rows and the number of columns.
The values presented in table no. 1 are imported from the SPSS output sheet. Interpreting the results we can affirm that for ASE the „Sex” variable has a weak influence (V=0,188; significant for 99,998%) and in the case of UAIC from Iasi the influence of this variable is stronger (V=0,357; significant for 99,9999%)
Then we further analysed the time spent by the students in front of the computer on main types of activities. In order to do that the students were asked to specify in percentage terms how much of their time they allocate for the following activities:
- Projects or any other assignments for school;
- Internet based documentation;
- Chat, e-mail, entertainment (games, movies, music).
The average percentages were computed for each activity. In order to rank the time allocated on activities we decided to test the difference’s significance between the average percentages. The Student test for dependent samples was used as we had pair observations. The results are presented in Table no. 2, again imported from the SpSS output sheet.
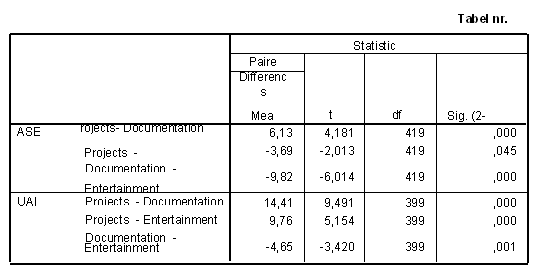
The calculated values of the Student test (see table no. 2) show that there are significant differences between the average percentages for the three activities. We can affirm with a probability of 95,5% that the time spent by the ASE students on various types of activities are ranked:
|
ASE Bucharest |
||||
|
Internet documentation 28,06% |
< |
Projects 34,19% |
< |
Entertainment 37,87% |
Regarding the UAIC Iasi students’ opinions, we can affirm with a probability of at least 99,9% that the time allocation on activities follows the order:
|
UAIC Iasi |
||||
|
Internet documentation 27,15% |
< |
Entertainment 31,79% |
< |
Projects 41,55% |
The information needs of the students (learners) who go for this form of study are similar to ones from the traditional education, only the these needs are satisfied are different.
In order to asses the e-learning model, the respondents have been asked to evaluate it in comparison with the traditional lectures model by assigning scores on a scale from 1 to 5, where 1 means not good at all and 5 means much better.
The criteria used to asses e-learning are:
C1: „Efficiency”;
C2: „Comprehension”;
C3: „The volume of acquired knowledge”;
C4: „Adaptability for all users”;
C5: „ Lectures’ update”;
C6: „Opportunity offred to take classes not included in the traditional offer”.
Figure no.2 Assessment criteria for e-learning/traditional model
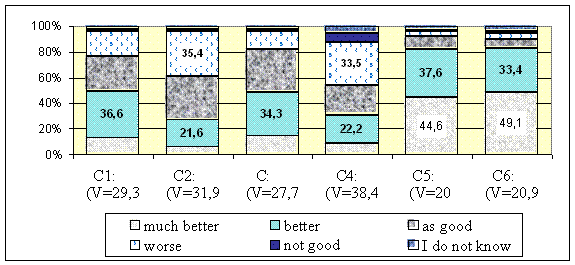
Interpreting the average scores we can deduce the following conclusions:
C4: „Adaptability for all users”. At first sight this is the weakest criterion (33,5% from respondents consider that the e-learning model is worse). But the average score of 2,9 is not a representative value as the variation coefficient is 38,4%. The analysed population is not homogeneous when assessing the e-learning model using this criterion.
C2: „Comprehensiveness”. This assessment criterion too ranks poorly the e-learning model. 35,4% from the respondents considers that e learning is worse than the traditional method. The average score of 2,94 is a representative value for the studied population (variation coefficient is less than 35%).
Using criteria C1: „Efficiency” and C4: „Adaptability for all users” the students incline in a bigger proportion toward the variant “better”. Regarding the criteria C5: „Lectures’ update” and C6: „Opportunity offered to take classes not included in the traditional offer” the respondents’ perception is totally different, 44,6% respectively 49,1% qualifying the e-learning model „much better”.
Figure no.3 Students’ options regarding the instruction methods on stages
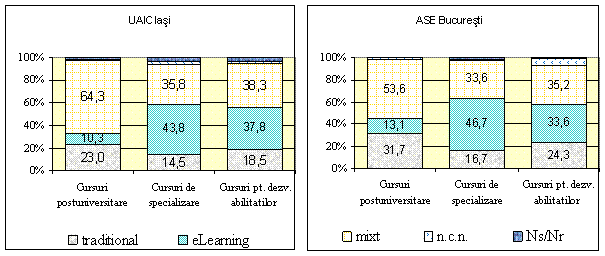
For postgraduate courses, both Iasi and Bucharest students (in a proportion of 64,3%, respectively 53,6%) consider that the most appropriate instruction model would be a mixture of both models able to combine and even boost the advantages. The students’ opinions are influenced by the variable „Sex”. Therefore, 35,4% from the male students are in favour of the traditional model, and only 24,8% from the female students. The difference between the two proportions is statistically significant for a probability of 99,9999%, the calculated value of the two tailed Student test used to compare the two proportions is 5,79. The mix model is preferred in a bigger proportion by female students (64% compared with 47,1%).this case the calculated value of the Student test is 6,25, again the difference is statistically significant for a probability of 99,9999%.
For the short term postgraduate courses of specialisation the students’ option concentrate on the e-learning model, where the variables „sex”, „urban or rural”, „income” do not have a significant influence.
Regarding the personal skills improvement lectures the students’ option are balanced between the two models: e-learning and mix model.
Conclusions
Instruction methods based on e-learning assume IC&T mastery as well as computer skills. The reduced number of hours spent in front of the computer; especially by the Iasi students show that they are still not ready for this form of learning. Moreover, from the overall time spent in front of the computer, the least is spent for documentation. We can affirm that Bucharest students place the computer among the entertainment tools. While the Iasi students, although they spend less time in front of the computer they dedicate more time for projects or other school required assignments. This aspect is explained by the difference in access to the informatics infrastructure of the students from the two university centres.
E-Learning lectures are perceived as being able to continuously update their content with fresh information. At the same time, institutions, which offer this type of classes, can have a richer educational offer compared with the traditional education system.
Still important criteria as „Efficiency” and „Comprehension” are poorly ranked. The students do not have enough information regarding these lectures, therefore they do not perceive the following advantages of this method:
These advantages prove the efficiency of the e-lectures and they stimulate the students’ understanding capacity. In time, these instruction methods will gain more and more followers and they will be included in the existing educational system and they will contribute to the training.
References
(top)
