|
|
||||
An Application of Mindsadbesd Regression

Ciprian Costin Popescu
Sudradjat Supian
Keywords
mindsadbesd regression, application, fuzzy models
Table of Contents
The minsadbesd approach
Example
Conclusions
References
Abstract
In this work, an application of the modified minsadbed (minimizing sum of absolute differences between deviations) approach for a fuzzy environment is given. This type of regression was used for a statistical model with two real parameters and experimental observations which implies real numbers (see Arthanary and Dodge). We develop minsadbed to minsadbesd (minimizing sum of absolute differences between squared deviations) which is more suitable for our model on vague sets. The models on fuzzy sets are described by Ming, Friedman and Kandel; these authors estimate the parameters pre-eminently using least squares. We make an attempt for another method, as in the following writing.
The minsadbesd approach
Consider the model composed by
 observations
 which are put in the forms
 ,
,
 where
where
 ,
,
 ,
,
 ,
,
 are real functions defined on closed interval
 (see Goetschel&Voxman, Ming,
Friedman and Kandel). The model
is approximately described by a regression line given by the equation
(see Goetschel&Voxman, Ming,
Friedman and Kandel). The model
is approximately described by a regression line given by the equation
 ,
,
 of form
 ,
where
,
where
 const.
 ,
,
 const..
Thus we have the initial relation
const..
Thus we have the initial relation
 .
For the inputs
.
For the inputs
 the distance between an observed value
 and the corresponding theoretical value
 is:
is:
 if
if

and
 if
if
 .
.
Case 1:
 .
.
In this case we solve the problem under the assumption that
.
The minsadbesd algorithm lead us to solve the problem
 (1.1)
(1.1)
or

 (1.2)
(1.2)
For all
 ,
,
 ,
we make the substitutions:
,
we make the substitutions:
 ,
,
 ,
,
 ,
,
 .
.
Thus (1.2) is equivalent to


 (1.3)
(1.3)
or
 (1.4)
(1.4)
where
 ,
,
 ,
,
 .
.
Let
 .
For function
.
For function
 ,
we have
,
we have

The sign of the discriminant is unknown. We have four cases which depends on signs
of
 ;
consequently, the graph of
;
consequently, the graph of
 has one of the forms shown in Fig. 1-4.
Case 1.1.
The "easy" case appears when all the discriminants are negative, namely .
In this situation the functions have the forms shown in Fig. 3 or Fig. 4.
.
In this situation the functions have the forms shown in Fig. 3 or Fig. 4.
The problem (1.4) is equivalent to

 (1.5)
(1.5)
where
 ( this writing means that some of the terms are positively and the others
are negatively, depending on the concrete signs of
( this writing means that some of the terms are positively and the others
are negatively, depending on the concrete signs of


The unique minimizing point for the function
 (see also Fig. 5) is

Case 1.2.
 have random signs.
The graph of the continuous function
 is composed from small pieces which are parts from the functions given by the equations

 are real numbers with general form


 (see Fig. 6). We consider the following sets:


Thus the feasible set is

 which is relatively easy to settle, as in Section 2.
Case 2:
.
 (1.6)
(1.6)
gives

 (1.7)
(1.7)
The problem (1.7) is equivalent with


(1.8)
which becomes
 (1.9)
(1.9)
if
 .
.
We denote
 .
For function
.
For function
 ,
we have
,
we have

Case 2.1.
First, we consider the case
 .
.
Thus the graph of
 has one of the two forms shown in Fig. 3 and Fig. 4.
Then the problem (1.9) is equivalent with

 (1.10)
where


The unique minimizing point for function
 is
is

The approach is the same as in first case but with other coefficients.
In both situation,
 is obtained from the condition that the line pass through the initial fixed point.
Case 2.2.
All the comments stored in case 1.2 keeps their validity.
For


 we have


 and (1.4) is equivalent with
 (1.11)
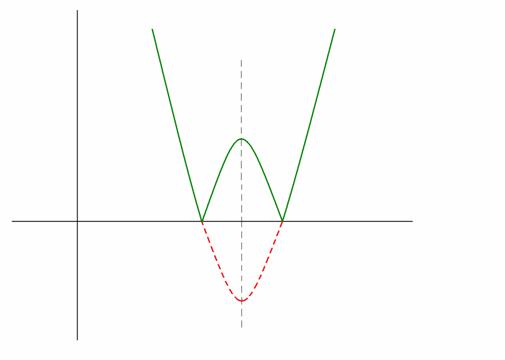
Figure 1. The graph of
(green) if
 and
and

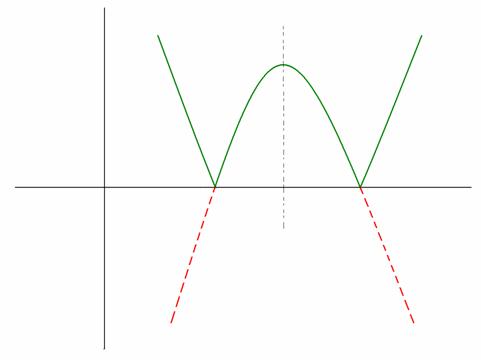
Figure 2. The graph of
(green) if
and

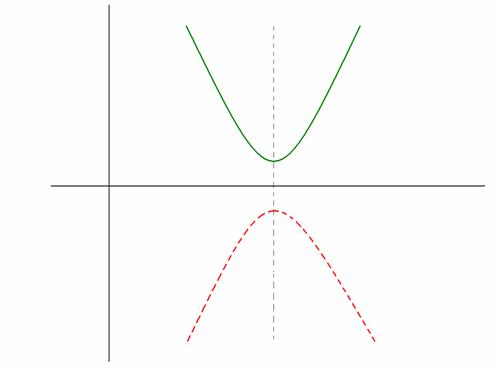
Figure 3. The graph of
 if
if
 and
and

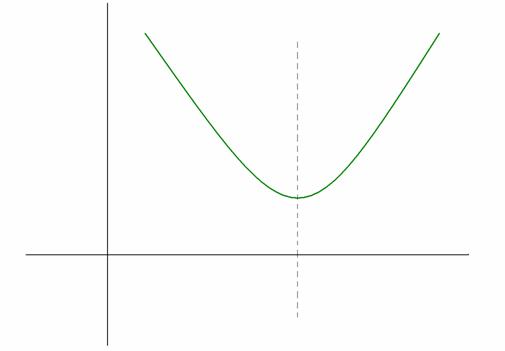
Figure 4. The graph of
if
and
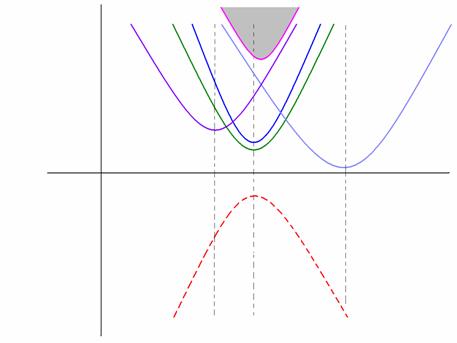
Figure 5. The graphs of the functions,
 when
when
 ;
the surface bounded by the graph of
is colored in gray
;
the surface bounded by the graph of
is colored in gray
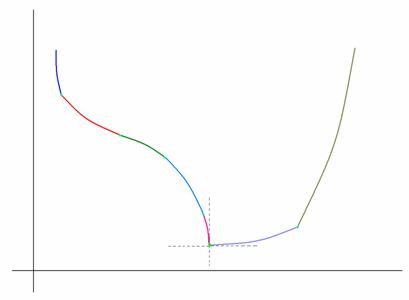
Figure 6. The graph of the function
when
 have random signs
Example
We test the method for fixed point
 and the fuzzy data:


Then
|
|
|
|
|
|
|
1 |
|
|
|
|
|
2 |
|
|
|
|
|
3 |
|
|
|
|


|
|
|
|
|
|
|
1 |
9.66 |
32.66 |
16.50 |
15.5 |
|
2 |
0.58 |
108.66 |
21.00 |
20.00 |
|
3 |
43.33 |
55.33 |
46.66 |
36.00 |


and


Case 1: We search the minimizing points for the function

Accordingly to the facts proved in the preceding chapters, namely Section 1, case
1.2, the set of feasible points is
 ( notice: for this example we obtain


Case 2: We search the minimizing point for

 and the minimum is attained in

 on
on
 we conclude that the estimators for
 are the real numbers
 where
where
 and
and
 depends by the desired threshold of error. If

 then
then
 is a better estimator.
At last, we have
 and
and

 for all
 and the final solution for this problem is

Conclusions
From the preceding theoretical facts and numerical example we obtain the following conclusions:
1) For
 ,
,
 , we evaluate
 and
and
 .
.
If
 thus the solution is
 .
.
If
 thus the solution is
 .
.
2) For
,
 or
or
 ,
,
 it is necessary to make small supplementary calculations which implies the special
properties of the functions
it is necessary to make small supplementary calculations which implies the special
properties of the functions
References
1. Arthanary T. S., Yadolah Dodge, Mathematical Programming in
Statistics, John Wiley and Sons,
2. Wu Cong-Xin and Ma Ming: Embedding problem of fuzzy number space: Part I, Fuzzy Sets and Systems 44, 1991, p. 33-38
3. Wu Cong-Xin and Ma Ming: Embedding problem of fuzzy number space: Part III, Fuzzy Sets and Systems 46, 1992, p. 281-286
4. P. Diamond and P. Kloeden, Metric spaces of fuzzy sets, Fuzzy Sets and Systems 35, 1990, p. 241-249
5. P. Diamond, Fuzzy least squares, Inform. Sci. 46, 1988, p. 141-157
6. P. Diamond and P. Kloeden, Metric spaces of fuzzy sets, Corrigendum, Fuzzy Sets and Systems 45, 1992, p. 123
7. R. Goetschel, W. Voxman, Elementary Calculus, Fuzzy Sets and Systems 18, 1986, p. 31-43
8. I.M. Hammerbacher and R. R. Yager, Predicting television revenues using fuzzy subsets, TIMS Stud. Management Sci. 20, 1984, p. 469-477
9. A. Katsaras and D. B. Liu, Fuzzy vector spaces and fuzzy topological vector spaces, J. Math. Anal. Appl. 58, 1977, p. 135-146
10. Ma Ming, M. Friedman, A. Kandel, General fuzzy least squares, Fuzzy Sets and Systems 88, 1997, p. 107-118
11. C. V. Negoita and D. A. Ralescu, Applications of Fuzzy Sets to Systems
Analysis, Wiley,
12. H. Prade, Operations research with fuzzy data, in: P. P. Wang and
S. K. Chang, Eds., "Fuzzy sets: Theory and Application to Policy Analysis and Information
Systems", plenum,
13. M. L. Puri and D. A. Ralescu, Differentials for fuzzy functions, J. Math. Anal. Appl. 91, 1983, p. 552-558
14. H. Tanaka, H. Isibuchi and
15. H. Tanaka,
16. H. J. Zimmermann, Fuzzy programming and linear programming with several objective functions, Fuzzy Sets and Systems 1, 1978, p. 45-55
17. R. R. Yager, Fuzzy prediction based upon regression models, Inform. Sci. 26, 1982, p. 45-63