|
|
||||
The Analysis of the Telecommunications Sector by The Means of Data Mining Techniques

Keywords
telecommunication sector, self-organizing map, decision trees, performance benchmarking, data mining techniques
Table of Contents
Introduction
Data-mining techniques
The telecommunication dataset
Experiment
Conclusion
References
Abstract
Nowadays, the Internet comprises of huge amount of electronic information concerning different companies’ financial performance. This amount greatly exceeds our capacity to analyze it, the problem being that we often lack tools to quickly and accurately process these data. DM techniques are interesting mechanisms that can be applied to rapidly changing industries, in order to get an overview of the situation. One such market is the international telecommunications industry. In this paper we construct a framework using DM techniques that enables us to make class predictions about telecommunication companies’ financial performance. Our methodology allows us to analyze the movements of the largest telecommunications companies, to see how companies perform financially compared to their competitors, what they are good at, who are the major competitors in this industry, etc. The dataset contains 88 companies from five different regions: Asia, Canada, Continental Europe, Northern Europe, and USA, and consists of seven financial ratios per company per year. The data used to calculate the ratios were collected from companies’ annual reports (between 1995 and 1999), using the Internet as the primary medium. We used data from 2000 and 2001 to test our classification models. We have obtained good maps (SOMs) in terms of ease-of-readability and the average quantization error and clearly identified the six financial performance clusters. The results of our class prediction models also correspond very well with the SOM model.
Introduction
The international telecommunications play an important role in today’s market dynamic. In the last decade a dramatic change in the ownership structure of telecommunications companies has taken place, from public (state-owned) monopolies to private companies. The rapid development of mobile telephone networks and video and Internet technologies has created enormous competitive pressure on the companies. As new competitors arise, companies need intelligent tools to gain a competitive advantage. Also, stock market expectations are enormous, and investors and financial analysts need tested tools to gain information about how companies perform financially compared to their competitors, what they are good at, who the major competitors are, etc. (Karlsson et al., 2001). In other words, the telecom companies need to benchmark their performances against competitors in order to remain important players in this market.
There is a huge amount of information about these companies’ financial performance that is now publicly available. This amount greatly exceeds our capacity to analyze it, the problem being that we often lack tools to quickly and accurately process these data. The aim of this paper is to analyze comparatively the financial performance of international telecom companies by the means of Data Mining techniques.
Data-mining techniques
Data-Mining techniques have different features that make them suitable for analyzing great amount of data. The goal of the DM is to discover new patterns in data, while most analytical tools (query and reporting tools, statistical analysis packages, online analytical processing - OLAP - and visualisation tools) are based on verification where "the system is limited to verifying user’s hypotheses" (Fayyad et al., 1996). The problem with the verification-based approach is that it "relies on the intuition of the analyst to pose the original question and refine the analysis based on the results of potentially complex queries against a database" (Moxon, 1996). Among the factors that limit the reliability of verification-based analytical tools are the ability of the analyst to pose appropriate questions and to manage the complexity of the attribute space. DM supports the discovery-based approach since "one defining data-mining characteristic is that research hypotheses and relationships between data variables are obtained as a result of (instead of as a condition for) the analyses activities" (Romeu, 2001). The discovery goal of the DM process can be further divided into prediction, where the system finds patterns or models for the purpose of future predictions and description, where the discovered patterns are presented in a human-understandable way to the user. In this paper we combine the two different goals of the DM process: we are interested in finding both patterns (models) that describe the financial situation of companies as well as models for financial (class) predictions.
In order to fulfil its role DM could perform a number of tasks such as clustering, classification, regression, dependency modelling, summarisation, and change and deviation detection. The link between these tasks and the real-world applications or business problems (the final goal of DM is to address these problems) is not straightforward, because real-world applications rarely have a simple single solution. Many different tasks may match a particular application, depending on how one approaches the problem (Smyth, 2002). For example, in this paper, the real-world application would be to assess telecom companies’ financial performance. Treating our problem as a supervised learning task implies that we already have financial performance classes for all the observations used to train the classifier. Actually there are no labelled data available, thus, the class variable has to be created at the beginning, by treating our problem as an unsupervised task. Only after the class variable has been constructed, can a classifier be trained. Smyth (2002) pinpoints various advices worth consideration when linking real-world applications with the data-mining task. The author states that it is advisable to start with only one task to address a real-world application and, only if necessary, add more complex ones. He also suggests removing the irrelevant details of the original formulation of the problem so that it resembles more closely a standard textbook task description. In order to select the proper task for a given problem, the data miner should have a complete understanding of both the business problem addressed and the task linked to it. Finally, Smyth (2002) states that it is better to approximate the solution to the right problem than it is to solve the wrong problem exactly.
In this paper, we have used Self-Organizing Map (SOM) algorithm to build the class variable and, then, we applied the induction of decision trees (famous Quinlan’s See5.0 tree-induction algorithm) in order to extract some rules of how to predict the performance of different telecom companies as data become available. For a detailed technical explanation of the two algorithms (SOM and See5.0) the reader is referred to Kohonen (1997) for SOM and Quinlan (1993) for See5.0.
The telecommunication dataset
We characterise companies’ financial performance by calculating the following ratios (see Table 1). This ratio classification is the most common financial ratio classification (Lev 1974, p. 12; Lehtinen 1996, p. 44) and has proposed the following categories for financial ratios: profitability, short-term solvency (liquidity), long-term solvency, and efficiency ratios.
Table 1. Formulas of financial ratios
|
Dim.
|
Ratio |
Formula |
|
Profitability |
Operating Margin |
|
|
Return on Equity |
|
|
|
Return on Total Assets |
|
|
|
Liquidity |
Quick Ratio |
|
|
Current Ratio |
|
|
|
Solvency |
Equity to Capital |
|
|
Interest Coverage |
|
|
|
Efficiency |
Receivables Turnover |
|


The dataset contains 88 companies from five different regions: Asia,
Further details in choosing the companies and how the data were collected can be found in Karlsson (2002).
Experiment
In this experiment we assess comparatively the financial performance of international telecommunication companies. Our results are presented in the following publications: Costea et al. (2002a, b), extended in Costea and Eklund (2004), applies SOM and the three classification techniques to assess telecom companies’ financial performance, Alcaraz and Costea (2004) introduces Weighting FCM to benchmark the telecom companies, Costea and Nastac (2005) studies three factors that can affect the classification performance of ANNs in the telecom sector data. In this paper we will present how a clustering technique (SOM) and a tree-induction technique (See 5.0) can be combined to assess comparatively financial performance of telecom companies.
Firstly, we applied SOM to the telecom data set. We used data from 1995 to 1999 (462 rows) to build the SOM map (see Figure 1) and train our See 5.0 classification model and the data for 2000 for the Scandinavian companies (11 rows) to test the prediction power of the tree-induction model.
Figure 1. Final 9x6 SOM for the telecom data set with identified "real"
clusters and feature planes
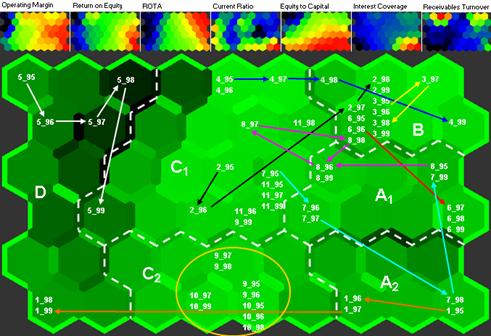
Source: Costea, 2005
The borders of the "real" clusters are identified by the dotted lines. Feature planes for each financial ratio are shown at the top of the figure ("warm" colours indicate high values, whereas "cold" colours indicate small values). The financial ratios are presented in Table 1. Trajectories for the Scandinavian companies between 1995 and 1999.
After we attached the classes to each data row, we applied the tree-induction classification technique See5.0 (Quinlan, 1993). The training and testing accuracy rates for See 5.0 are presented in Table 2.
Table 2. Accuracy rate validations for the classification model.
|
Main dataset |
Part1 (split=0) |
Part2 (split=1) |
|
|
Learning Sample (75%) |
95,1% |
91,8% |
93,5% |
|
Test Sample (25%) |
87,9% |
89,6% |
85,7% |
|
cross-validation |
86,4% |
no cross-validation |
no cross-validation |
Source: Costea, 2005
The validation is done according to step 5 of the methodology presented at the beginning of Section 5.2 in Costea (2005).
See 5.0 classification technique achieved high accuracy rates in both training and testing. Also, the See5.0 training accuracy rates are validated against the testing accuracy rates (small differences).
In Table 3, the class predictions based on financial data for the year 2000 are illustrated:
Table 3. Class predictions for Scandinavian telecommunications companies in 2000.
|
Company
|
OM |
ROTA |
ROE |
CR |
EC |
IC |
RT |
label |
Predicted Cluster |
|
See 5.0 |
|||||||||
|
-17,03 |
-30,02 |
-74,64 |
1,22 |
25,10 |
-12,05 |
5,93 |
1_00 |
D |
|
|
Doro |
-2,12 |
-3,90 |
-63,70 |
2,24 |
13,87 |
-1,27 |
6,85 |
2_00 |
D |
|
Ericsson |
11,40 |
14,63 |
67,26 |
1,89 |
16,81 |
7,52 |
3,95 |
3_00 |
B |
|
HPY |
11,99 |
7,702 |
10,87 |
0,53 |
15,71 |
3,84 |
5,81 |
4_00 |
C1 |
|
NetCom |
18,77 |
14,77 |
66,37 |
2,75 |
16,02 |
4,14 |
10,10 |
5_00 |
B |
|
Nokia |
19,02 |
34,98 |
52,50 |
1,57 |
52,23 |
50,76 |
5,10 |
6_00 |
A2 |
|
Sonera |
84,98 |
30,11 |
140,16 |
0,80 |
18,47 |
12,77 |
1,08 |
7_00 |
B |
|
TeleDenmark |
29,08 |
22,27 |
49,47 |
1,19 |
36,96 |
6,86 |
2,65 |
8_00 |
A1 |
|
TeleNor |
9,91 |
5,58 |
6,77 |
1,02 |
24,53 |
2,00 |
4,42 |
9_00 |
C1 |
|
Telia |
22,21 |
12,08 |
22,40 |
2,38 |
51,02 |
41,57 |
2,52 |
10_00 |
A2 |
|
Average |
18,82 |
10,82 |
27,75 |
1,56 |
27,07 |
11,61 |
4,84 |
11_00 |
C1 |
Source: Costea et al., 2002a
The financial ratios are presented in Table 1. The technique used is: Quinlan’s See5.0.
These classification models can help the companies involved in the analysis in the following way: if the company predicts the financial ratios for the next time period, based on this model it can have a picture of what its position would be compared with the other companies. In other words the company would know where it would be situated on the financial performance map. Moreover, the beneficiary (the company in question) can build different scenarios regarding what happens in terms of profitability, liquidity, solvency and efficiency if some of the financial ratios are relaxed.
Another beneficiary of these models would be the potential investor that would like to invest in the telecommunications sector and would want to weigh his/her investment opportunities.
Conclusion
In this paper we showed how Data Mining techniques can be used to build classification models with which companies from different sectors, e.g. the telecommunications sector, can be compared based on their financial performance. In this attempt we have build a financial performance map (using the SOM clustering algorithm) and identified several financial performance clusters. Then, we have used a tree-induction algorithm, namely Quinlan’s See5.0 to model the relationship between the newly-built class variable (which shows the financial position/cluster for each observation) and the financial ratios which depict four performance dimensions: profitability, solvency, liquidity and efficiency.
Our results are good with regard to the validation criteria as well as to their interpretability and practical implications.
References
1. Alcaraz-Garcia AF, Costea A. A Weighting FCM Algorithm for
Clusterization of Companies as to their Financial Performances, Proceedings
of the "IEEE 4th International Conference on Intelligent Systems Design and Applications"
(ISDA 2004),
2. Costea A, Eklund T, Karlsson J. Making Financial Class Predictions
Using SOM and Two Different Classification Techniques: Multinomial Logistic Regression
and Decision Tree Induction. Proceedings of the "Central & Eastern European
Workshop on Efficiency and Productivity Analysis". AES Press,
3. Costea A, Eklund T, Karlsson J. A framework for predictive
data mining in the telecommunication sector. Proceedings of the "IADIS International
Conference" - WWW/Internet, Isaías P. (ed.). IADIS Press,
4. Costea A, Eklund T. Combining Clustering and Classification
Techniques for Financial Performance Analysis. Proceedings of "8th World Multi-Conference
on Systemics, Cybernetics and Informatics" (SCI 2004), Callaos et al.
(eds.), Organized by IIIS,
5. Costea A. Computational Intelligence Methods for Quantitative
Data Mining. Turku Centre for Computer Science, Ph. D. thesis, No. 67,
6. Costea A,
7. Fayyad U, Piatetsky-Shapiro G, Smyth P. Knowledge Discovery and Data Mining: Towards a Unifying Framework. Proceedings of the "Second International Conference on Knowledge Discovery and Data Mining" (KDD’96), E. Simoudis, J. Han, and U. Fayyad (eds.), AAAI Press, Portland, Oregon, pp. 82-88, August 2-4, 1996
8. Karlsson J, Back B, Vanharanta H, Visa A. Financial Benchmarking of Telecommunications Companies. TUCS Technical Report 395, February 2001.
9. Karlsson J. Data-Mining, Benchmarking and Analysing Telecommunications
Companies. Licentiate dissertation,
10. Kohonen T. Self-Organizing Maps. 2nd edition, Springer-Verlag,
11. Lehtinen. Financial Ratios in an International Comparison. Validity and
Reliability. Acta Wasaensia 49,
12. Lev B. Financial Statement Analysis. Englewood Cliffs, New Jersey, Prentice-Hall Inc, 1974
13. Moxon B. Defining Data Mining - The Hows and Whys of Data Mining, and How It Differs From Other Analytical Techniques, 1996 [Available at:
http://www.dbmsmag.com/9608d53.html] (Accessed on: 10.10.2006).
14. Quinlan JR. C4.5 Programs for Machine Learning. Morgan Kaufmann Series
in Machine Learning. Morgan Kaufmann Publishers,
15. Romeu JL. Operations Research/Statistics Techniques: A Key to Quantitative
Data Mining. Proceedings of FCSM "Federal Committee on Statistical Methodology"
Conference,
16. Smyth P. Selection of Tasks. Handbook of Data Mining and Knowledge Discovery
- Task and Method Selection (Section 17.1 - pp. 443-444). Willi Klosgen
and Jan M. Zytkow (eds.),