 |
|
|||
The Evolution of Economist's Labour Market in Romania
Alexandru Isaic-Maniu
Claudiu Herteliu
Keywords
Economists, Labour market, Education market, Statistical survey, ASE Bucharest, Romania
Table of Contents
General context
Methodology and data sources in the dimensioning of labor market with superior economic studies
The economic studies graduates and the position of ASE on the market of economists’ preparation
The evaluation of the labor market size - short incursion
Conclusions
References
Abstract
It is mentioned very often recently, as much in the political speech as in the analyses and the comments that refers to the educational sector, the bad adaptation to the requirements of the labor market. In most cases, these ideas have more like a character of "folklore", because there isn’t any reliable statistic information. As it follows, we intend to explain several unpublished results of some statistical surveys focused on the analysis of the academic education in the economy field in Romania and on the insertion of the graduates on the labor market.
General context
Under the circumstances of the well known globalization, the academic education started with an ample program of reform for the whole system - generic known through the phrase “The Process from Bologna”, which is trying to solve the new demands, the new pressures and requirements of the economic and social environment which keeps changing.
The ensemble of the European educational politics based on constitutive and the U.E.'s expansion lead to the formation of a so called "European Area Of Higher Education". In our country beside the process of modernization and alignment to the European context is present also the problem of permanent accommodation to the requirements of the labor market, expression of the dynamics of the socio-economical systems.
On this market, the economical higher education has a specific place which we intend to estimate.
The size of the economist's labor market, as any another market, enforces the evaluation of the two major perspectives: the supply and demand.
The supply and demand in the higher economic education has two senses.
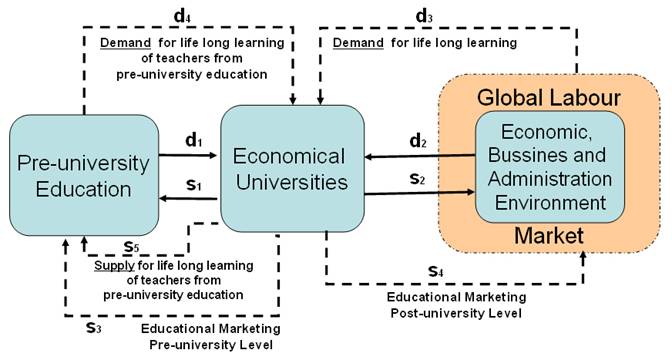
The first of them coincide the entries in the educational system. In this acceptance there are a lot of universities that provide economical education. On the other hand, the high school graduates wish to continue the studies and can choose the economical higher education. This represents the demand for the system of economical universities. Being given the rational choice of the consumer (advised by the parents, by his relatives but especially by friends) the superior quality or less superior (from viewpoint of the scholastic previous performances) of those who those that form the demand for economic preparation (d1) illustrates for a certainty the position that holds the institutions of economic higher educations in our country. Considering the preliminary results of a statistical survey[3] through soundings, recently developed among the poor families that have children in the pre-university education, the parents wants for the female children to have a occupation for which ASE (Academy of Economical Studies) in proportion of 18 percent, and in the case of male children, in a way surprisingly, the proportion reaches even 22 percent. Another recent study accomplished in schools from the pre-university education[4], among the professions desired by parents for their children, we can remark: 10 percent programmers, 8 percent manager / enterprising manager / managing positions, 3 percent bookkeeper, 1 percent in the financial banking area. ASE offers, therefore, specializations for 20 percent of the desired jobs by parents for their children and sometimes since the secondary school. Before 1990, the choices of young high school graduates were especially targeted to the polytechnic studies and medicine, immediately after 1990 to economic studies and law studies, and currently to P.R., journalism, politic studies and communication studies.
A second explanation of the demand (d2) and supply (s2) refers to those who are getting out of the economic system preparation. The institutions of higher economic education “produce” graduates which constitute the primary demand on the labor market. In this case the supply is composed of economic agents that employ. There can be also identified secondary circuits generated by the universities in the pre-university education as well as to the economic field as supply (s4) in the continuous preparation programs, along the cycle of active professional life. We can also add the demand of specialized academics for the economical high schools that the pre-university education redirects to the economic universities, and vice-versa, the offer of university graduates for those jobs. Also, from the pre-university schools comes a demand (d4) to inform the specialty teachers (didactic degree I, II, etc.) with the corresponding supply (s5) in the opposite way.
Figure 1. The place of economic universities in the circuit of professional
formation of the economists
Methodology and data sources in the dimensioning of labor market with superior economic studies
The needed statistical data comes from the following sources:
Regarding the methodological aspects related to “non-conventional” data sources, the following amendments can be made:
The economic studies graduates and the position of ASE on the market of economists’ preparation
In the last years the high schools became extremely attractive for the young people in the age group 19-23 years, gross rate of capaciousness reaching 37, 9 percent in the session 2003-2004, almost 3 percent more than the previous year. In the session 2003-2004 were enrolled more than 620 thousand students, 4,1 percent more, comparative with the session 2002-2003, considering the condition that the school age population of the group 19-23 scaled down by 3,2 percent.
In the short-term education (colleges) were enrolled 46, 2 thousand students, with a weight of 7,4 percent from the total number of students.
Considering instructional forms, the gross weight consist of students that attend day courses (77,8 percent), open and distance education being in relative growth (11,1 percent), followed by the low frequency learning (10,7 percent), while the ratio of evening learning lowered to 0,4 percent.
The increase in the ratio of students attending low frequency and open distance courses are the expression of young people entering the economic activity[5] collateral to participating to the educational process.
From viewpoint of the specialization structure in the session 2003-2004, was noted a increase in the ratio of technical university students with 0,2 percent comparative to the year 2000, reaching 22,3 percent. Within the specializations ratio, the academic area has 30,2 percent, followed by the economic profile (27,8 percent), law school (9,8 percent) and medical- pharmaceutical (5, 3 percent).
In the short-term education, the ratios are: 39,7 percent in the academic area[6], 32,2 percent in the technical field, 13,2 economics and 14,9 percent in the field of agriculture, medical- pharmaceutical and artistic.
Excepting the technical and agricultural education, the ratio of female students is overwhelming.
Can also be mentioned that the particular alternative within education offer is well represented in the higher education area. Considering that in the session 1995/1996, the number of students of these institutions was 85.305, it reached 139.038 in the session 2002/2003 and 143.905 in the session 2003/2004. In 2003/2004 was noticed a increase with 4,9 thousands correlated with the year before. The ratio of this category of students within the total number was 23,2 percent.
All the institutions of higher educations are located in municipalities and towns, the region Bucharest-Ilfov having the biggest ratio (30,7 percent) as much in the public sector (25 percent), as the private one (49, 5 percent), followed by the region North-West with 14 percent. The region with the smallest ratio is the Southern (6,5 percent).
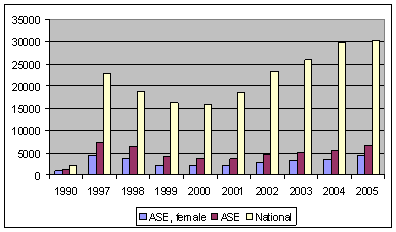
Coming back to the position of the Academy of Economic Studies, in the figure 2 is presented the number of graduates with superior studies, beginning with 1990 until 2005, with the emphasis of ASE.
Figure 2. The number of graduates with superior economic studies - total and ASE
Source: INS, 1990-2006.
Can be remarked the position still dominant of ASE on the market of economic universities in Romania, the market of the economic preparation area being in a "atomization process" by establishment of private universities in regional localities even small sized in terms of population and potential candidates. Table 1 presents the percentage evolution of ASE quota within all graduates of economic studies.
Table 1. Evolution of market quota of ASE from viewpoint of the number of
graduates in the economic area
|
Year |
1990 |
1997 |
1998 |
1999 |
2000 |
2001 |
2002 |
2003 |
2004 |
2005 |
|
Market quota ASE |
56,0% |
31,7% |
33,8% |
25,7% |
23,1% |
19,4% |
19,8% |
19,6% |
18,3% |
21,9% |
Source: Processed data provided by INS for the 1990-2006 period
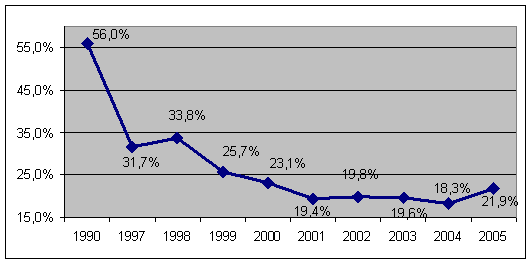
A graphic representation of the market quota of ASE is presented in the next figure (Figure 3), the image highlighting the strong decrease noticed between 1990 and 2000 and the relative stabilization afterwards.
Figure 3. The market quota of ASE from viewpoint of the weight of the graduates
in the economic area
Source: Processed data provided by INS for the 1990-2006 period
The competition become harsh on the market of economic universities through the establishment of economic faculties inside of state and private institutions and gradually diminished the market quota held by the Academy of Economic Studies, from half in 1990 and a third – 34 percent - in 1998, to a level placed around the value of 20 percent (18 percent in 2004 and 22 percent in 2005).
The evaluation of the labor market size - short incursion
The size of labor market directs to the evaluation of the two sides: demand and supply.
The results presented afterwards are based on the monitored small and large ads in the written press and also on some specialized websites. Based on this research resulted mainly the following aspects:
a) Supply of places of labor
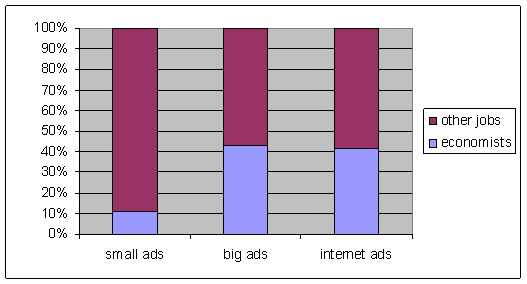
The measurement of the supply of labor places has the character of an estimation based on sounding research. Was monitored the small and large ads and some specialized websites. Also were surveyed the current numbers of the “Romania Libera” publication for 8 weeks as well as an representative sample of the editions between January 1990 - March 2006, respectively specialized websites on a period of three weeks. Table 2 presents the places of labor in the likeness of a structure: total, from which economists with superior studies, from which ones for Bucharest.
Table 2. Places of labor offered - general presentation
|
|
Small ads written press (sa wp) (%) |
Large ads written press (la wp) (%) |
Specialized websites (www) (%) |
|
Total places of labor |
100 |
100 |
100 |
|
- from which are economists |
10,7 |
43,4 |
41,5 |
|
- from which are for Bucharest |
72,8 |
51,9 |
62,7 |
|
* from which for economists |
10,3 |
43,1 |
42,5 |
Source: Own researches 2006: written press and specialized websites
Another aspect we believe attractively is incident to the size of the large ads. Each large add was measured from viewpoint of the length and the width in order to compare also the area, not only the frequency of appearance. Wasn’t considered if the add was polychrome or monochrome, and consequently, the average price that can be estimated may be a little underestimated[7].
The average area of the ads monitored and measured was of approximately 265 cm2. Considering the listed price of a black-and-white ad means that for each appearance was paid, on the average, about 500 Euro. We can suppose that, at large, the positions announced within large ads are important and obvious the retributions are on measure.
Figure 4. The structure of the offer of labor places depending on field of expertise
Source: Own researches 2006: written press and specialized websites
The “fight” between "small ads" versus "large ads" and "specialized websites" appears natural pursuant the fact that, usually, in the large ads the positions are definitely dominated by positions corresponding to superior studies compared to the positions for unqualified or qualified workers with no superior studies which appear more frequently in the case of small ads. Regarding the specialized websites the situation looks similar if we take into consideration the profile of the surfers on the internet. Thus, for instance, a firm that want to hire a caretaker has little or no chance to find it among the persons that searches a work place on the internet.
The economist’s eligibility for a certain job is determined by specific educational demands, mentioned on the most of the ads, or by the fact that one notices relatively vague ad (we hire young person with superior studies, knowledge of PC, driving license, experience in marketing, without obligations, speaking English language is an advantage etc.).
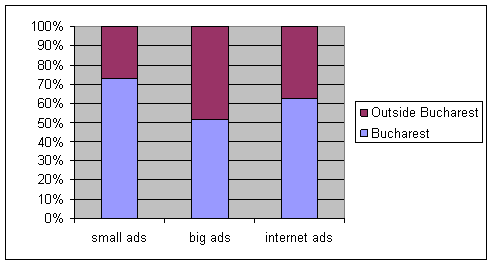
Figure 5. The structure of supply of labor places depending on the geographic zone
Source: Own researches 2006: written press and specialized websites
Data indicates a domination of the capital city within the supply of labor places (72,8 percent for the small ads, 51,9 for large ads and 62,7 in the case of the notices on the specialized websites), the capital city having also the lowest unemployment ratio (2,6 percent[8]).
The bigger number of labor places in the case of small ads offers us and the decryption key. For the proper positions corresponding to low levels of studies are preferred small ads in local newspapers, known the local affinity for the local press.
Large ads, correlated with the attractive salaries, are prevalent published in a national quotidian because in these cases can be considered also and a possible relocation of the employee, a relatively new aspect and which no longer represents a characteristic of the western countries.
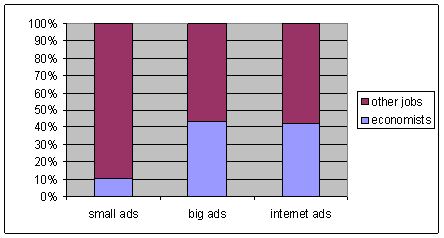
Figure 6. The structure of supply of labor places in Bucharest depending on field of expertise
Source: Own researches 2006: written press and specialized websites
Given the location of ASE in the capital city (mainly, the territorial centers having low age, low attendance number, and mostly a low impact) we intended to study also and the field of expertise of the ads Bucharest.
Were registered high rates in the case of internet ads or large ads, situation strictly correlated to the reorganization and development of economic area within the last years. Thus, shortly after 1989 appeared departments or even companies specialized on sales, marketing and brokerage, also in exponential rhythms developed the insurances companies, the banking sector from an incipient development level reached a explosive evolution, each one of the more than 500 IMM (Small and Medium Companies) requires financial and accounting assistance from specialists or specialized companies. Besides this fact, in ASE, the faculty of CSIE “produces" graduates that are successfully integrated and non-economical jobs[9], such as the one in the informatics area or in the area of modeling processes of decisional fundaments, in departments of analyses and strategists etc.
b) The demand of labor places
The estimation of the demand of labor places in general and of economists in particular, was accomplished using the same informational sources as the estimation of the supply. But on the other way the demand of labor places in the economic area can be estimated also by starting from the number of graduates (fault-free number with a percentage of those which are working already) whereat are added the graduates from older generations which are in quest of a place of labor. Another aspect implies that for a certain price (salary package), almost any employee can enter into the category of persons that forms the demand. In other words a employee that doesn’t search for a place of labor can accept a offer for a position in a organization without the classic necessary steps (deposit CV, initial interviews etc.). Consisted so the size of demand is relatively “volatile”, function of the work price. Given the situation in which is found our country, when salary raises (because of the imminent U.E. integration, of the appreciation of national currency) has become a usual fact that raises to relative high quotas the point where the demand meets the supply, leads to the mentioned “volatility”. In the table 3 are presented the results of monitoring the written press and websites.
Table 3. Estimation of places of labor demanded
|
|
Small ads written press (sa wp) (%) |
Specialized websites (www) (%) |
|
Total places of labor |
100 |
100 |
|
- from which are economists |
21,8 |
31,4 |
|
- from which are for Bucharest |
72,0 |
50,2 |
|
* from which for economists |
20,7 |
37,9 |
Source: Own researches 2006: written press and specialized websites
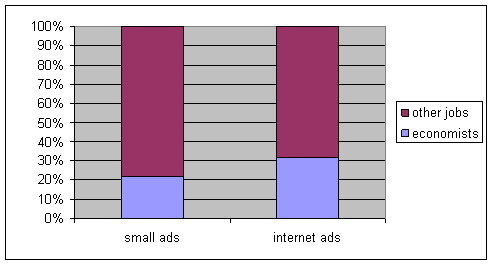
Figure 7. The structure of the applications of labor depending on area
Source: Own researches 2006: written press and specialized websites
From the results of the investigations undertaken, the ratio of economists in quest of a place of labor can’t be neglected. Some amendments are though welcomed. Thus, not for all people that search a place of labor means that have none at the respective moment; there is also the category of employees that want to change the place of labor (to a possibly better one).
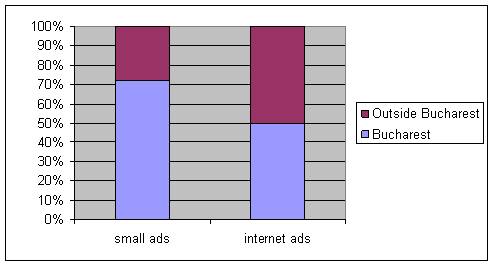
Figure 8. The structure of the labor places demands depending on the geographic zone
Source: Own researches 2006: written press and specialized websites
Also in the area of labor places demand is maintained a the difference "Bucharest" -"province", because the persons in quest of a place of labor in other localities of the country use, with preponderance, the local newspapers.
Regarding the www environment, the weight of the capital is reduced significantly but, most likely due to a rate of development of the Internet, and is registered thus a level (50,2 percent) high above weight hold by the capital in all the economy.
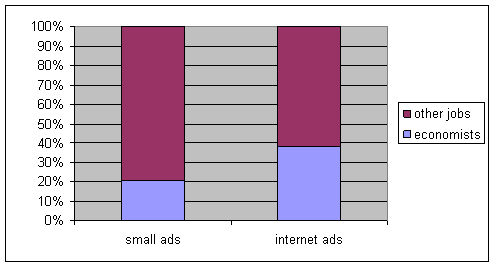
Figure9. The structure of labor places demand in Bucharest, depending on field of expertise
Source: Own researches 2006: written press and specialized websites
The previous reflections regarding the areas of interest of those that demand a labor place also keeps their signification in this case.
The high levels of demands of labor places placed by graduates of economic universities can indicate a higher mobility of the work force on the market, but also in a certain measure a masked advertising for consultancy services, as well as a weak insertion on the labor places market. Given the fact that the unemployment in Bucharest is among the lowest in the country, maybe the third presumption is the least plausible.
Conclusions
The result of demand meeting supply on the labour market could be measured in two dimensions: unemployment rate and labour price.
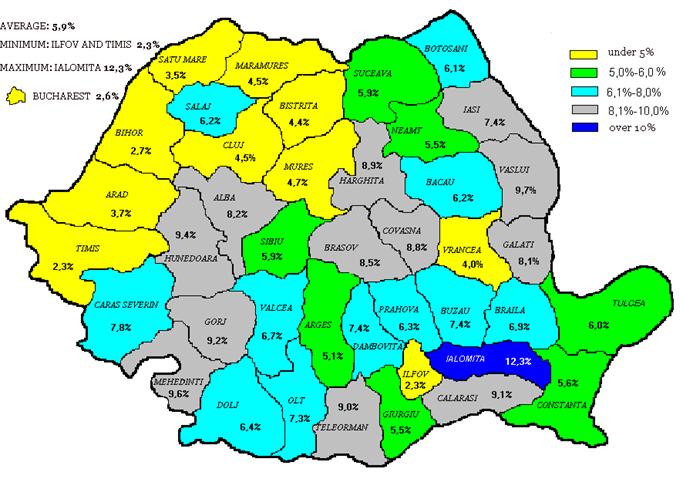
When talking about unemployment a higher rate means that on the labour market, demand exceeds supply. In the figure no. 10. it is shown the unemployment rates on the county level.
Figure 10. Unemployment rates on December 31st, 2005
Source: ANOFM, 2005 Annual Report
Bucharest (2,6%) and Ilfov (2,3%) register the lowest unemployment rates in the country. Not so good is the case of the Southern region where ASE is collecting most of its students from (for example: Ialomita -12,3% - is the highest unemployment rate in the country). It is very likely that these highschool graduated choose ASE based on their future intention to establish in Bucharest.
The low level of unemployment rate in Bucharest could be interpretated as a good insertion of ASE graduated in local labour market. This is also proved by the preliminary results of a statistic survey among ASE graduated. According to this survey only 14,5% of questioned graduated declared that they had a longer than three months period of unemployment. Supporting this conclusion and also indicated that ASE curricula responds to general demand are the 81% answers of those who admitted that their work follows their ASE formation.
Secondly the encounter between demand and supply from labour market is also set by labour price. Labour price is given by salarial package as contracted. Normally salarial package contains more than simple salary[10]. According to the preliminary results of student’s survey mentioned before, in the case of the ASE graduated income, studied from financial point of view, we may conclude that the average ASE graduated income is situated at 440 Euro which is significantly higher than national average salary of 240 Euro[11] (financial intermediations 732 Euro, industry 238 Euro, IT and research 364 Euro, administration 364 Euro, education 255 Euro). Using geographical criteria, the Bucharest-Ilfov region register an average salary of 295 Euro much more than 217 Euro as it is in North-East region.
References
End Notes:
[1] The scientific research activities were financial supported by ASE through “2007-2013 Strategy of Development Project”. We are grateful for constructive comments and suggestions which come from scientific research team: Ovidiu Nicolescu, Ion Verboncu, Mihai Korka, Constantin Popescu, Constantin Bratianu, Eduard Dinu, Marius Profiroiu, Ion Popa, Cristian Socol, Ionela Jianu, Andreea Dima and Sebastian Ceptureanu.
[2] Similar studies were conducted in other countries. We should mention: Towse, R. Blaug, M. The Current State of the British Economics Profession, Royal Economic Society, 1988; Freeman, R. It’s Better Being an Economist (But Don’t Tell Anymore), Journal of Economic Perspectives, Vol. 13, No. 3, Summer 1999, pag.. 139-145; Perry, K. Statistical Relationship of Accounting and Economics, The Accounting Review, Vol. 30, No. 3, July 1955, pag. 500-506; Greenaway, D. The Market for Economists in the UK: Editorial Note, The Economic Journal, March 1990; Thorton, R., Ward, J. The Economist in Tort Litigation, Journal of Economic Perspectives, Vol. 13, No. 2, Spring 1999, pag. 101-112
[3] Ministerul Educatiei si Cercetarii, Euro200 Impact, Bucharest, 2006 (preprint).
[4] Mantaluta, O. (coord.) Impactul resurselor materiale asupra reusitei scolare, ISE, Bucharest, 2005 paper available on the internet: http://portal.ise.ro/Management/tabid/83/Default.aspx
[5] Preliminary results of a statistical survey among ASE students conclude that 52,9% of them have had at least one part time job and 32,7% a full time one.
[6] Theoretical formation usually for pre-university education career.
[7] This underestimation is due to the fact that some big employment ads are polychrome, therefore more expensive.
[8] According to ANOFM 2005 annual activity report.
[9] Accordingly to a recent study published in Capital magazine, Faculty of Cybernetics, Statistics and Economic Computer Science from ASE comes on the second place after Faculty of Electronics, Telecommunications and Information Technology from University Politehnica of Bucharest (Chisu, V.A., Comanache, D. Top facultati, Capital magazine no. 23 from June 8, 2006, Bucharest, pag. 56-57) in the top of the facultaties form Bucharest-Ilfov region.
[10] This about health insurances, company cars, company mobile phones, paid vacations and other benefits.
[11] Source: * * *, Comunicat de presa privind castigul salarial din luna aprile 2006, INS, Bucharest, June 5, 2006
(top)
